
New Mortgage Rules Coming Jan 1 Boost November Home Sales
So here we are in the lead-up to the January 1 implementation of the new OSFI B-20 regulations requiring that uninsured borrowers be stress-tested at a mortgage rate 200 basis points above the contract rate at federally regulated financial institutions.

It is no surprise that home sales rose in advance of the new ruling. Even so, activity remains below peak levels earlier this year and prices continue to fall in the Greater Toronto Area (GTA) for the seventh consecutive month.
In a speech this week, Governor Poloz of the Bank of Canada confirmed his continued concern about household indebtedness. Indeed, data released this week by Statistics Canada showed that households continued to pile on debt in the third quarter. The household-debt-to-disposable-income ratio rose by a percentage point to 171.1% last quarter. Relative to assets and net worth, debt also edged higher, but those ratios are much closer to longer run levels, painting a far less dire picture of household finances. And even with households taking on more debt, the share of income needed to service that debt was little changed in Q3, as it has been over the last decade. That will change as the Bank of Canada continues to raise interest rates gradually. However, the prevalence of fixed rate mortgage debt means households won’t feel the increase all at once. Instead, the debt service ratio is likely to rise only gradually. The rising cost of borrowing and more stable home prices should slow credit growth in the year ahead.
But with so much attention paid to the imprudent borrower, I think it is important to reiterate that the vast majority of Canadians responsibly manage their finances. For example, roughly 40% of homeowners are mortgage-free, and one-third of all households are debt-free. Another 25% of households have less than $25,000 in debt, so 58% of Canadian households are nearly debt free. Hence, mortgage delinquency rates are meagre.
The Canadian Real Estate Association (CREA) reported yesterday that home sales jumped 3.9% from October to November–the second most significant increase in two years. Home sales have now risen for the fourth consecutive month, led by a 16% jump in the Greater Toronto Area (GTA), which accounted for two-thirds of the national rise. Even so, sales activity in the GTA was significantly below year-ago levels. Victoria, Ottawa and Regina also recorded strong gains, while Calgary, Edmonton and Montreal posted modest increases.
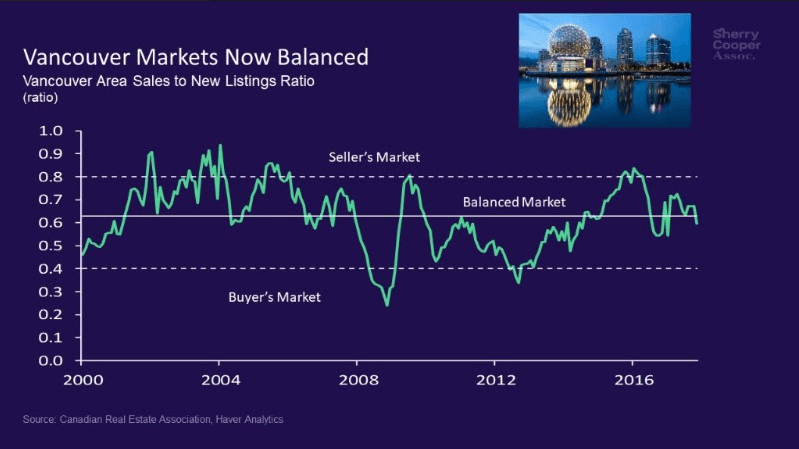
Not all markets participated in the rally, though. Vancouver was among the few holdouts. Resales fell for a second-straight month by 3.7% in the Vancouver area where affordability strains represent a major issue for buyers.
New Listings Shot Up
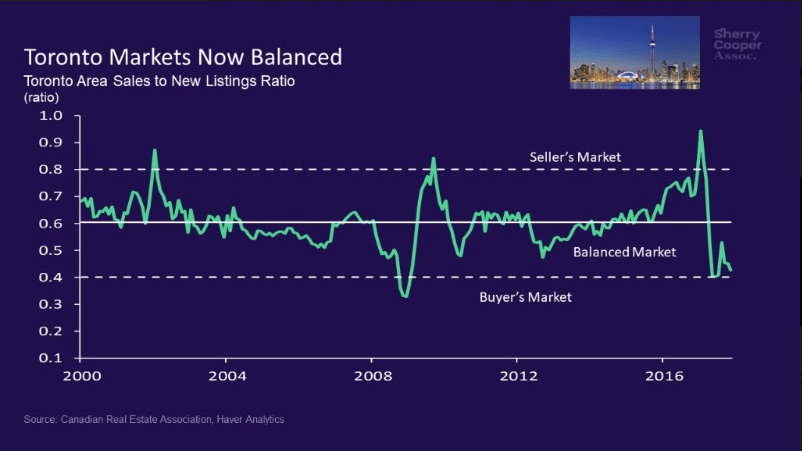
Many sellers decided to list their properties ahead of the mortgage rule changes. New listings rose by 3.5% in Canada between October and November. Most of this increase took place in the Toronto area where new listings jumped by a whopping 22.9%. A report released earlier this month by the Toronto Real Estate Board showed that active listings in Toronto rose modestly above their 10-year average in recent months after plunging to historic lows at the start of this year. Pressure has come off Toronto-area buyers as they are now presented with more options. This could soon be the case in Vancouver too. New listings rose sharply in November and, with resales declining in the past couple of months, the sales-to-new listings ratio is finally moving toward more balanced conditions (see charts below).
The number of months of inventory is another important measure of the balance between housing supply and demand. It represents how long it would take to liquidate current inventories at the current rate of sales activity. There were 4.8 months of inventory on a national basis at the end of November 2017 – down slightly from 4.9 months in October and around 5 months recorded over the summer months, and within close reach of the long-term average of 5.2 months. At 2.4 months, the number of months of inventory in the Greater Golden Horseshoe region is up sharply from the all-time low of 0.8 months reached in February and March.
Price Pressures Eased
The Aggregate Composite MLS® Home Price Index (HPI) rose by 9.3% y-o-y in November 2017 marking a further deceleration in y-o-y gains that began in the spring and the smallest increase since February 2016. The slowdown in price gains mainly reflects softening price trends in the Greater Golden Horseshoe housing markets tracked by the index, particularly for single-family homes.
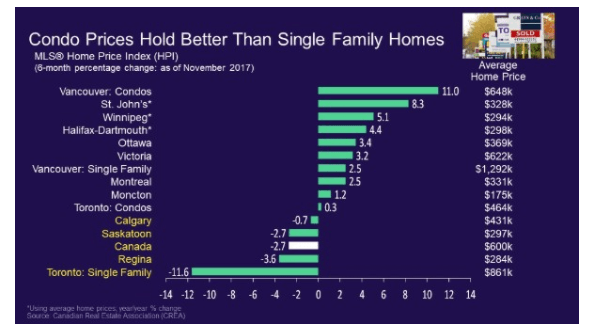
Toronto single-family house prices were down 11.6% over the past six months ending November 30 (see chart below). GTA condo prices have fared better, up 0.3% since late May, but the rise is minuscule in comparison to the booming price gains evidenced before the Ontario government’s ‘Fair Housing Plan’ that introduced, among other things, a 15% tax on non-resident foreign purchases of homes.
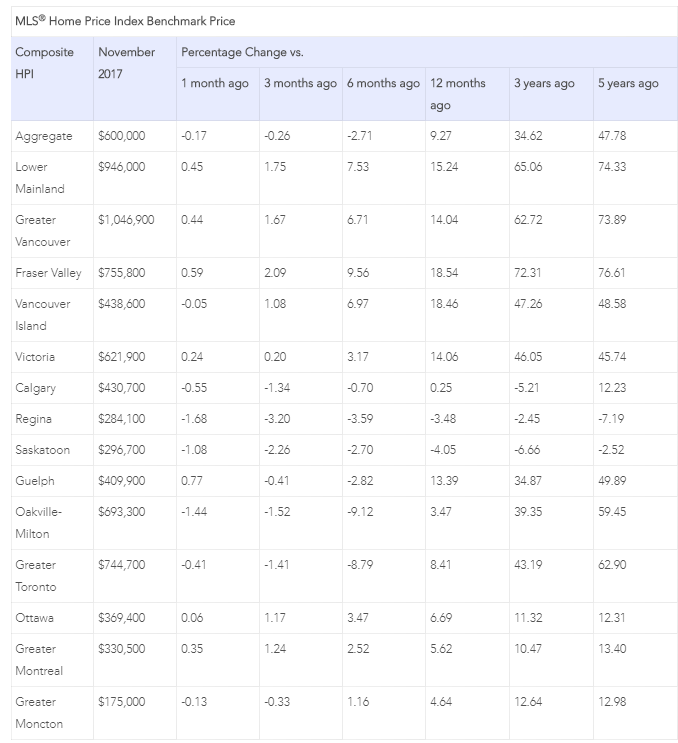
On a year-over-year basis, benchmark home prices were up in 11 of the 13 markets tracked by the MLS HPI. After having dipped in the second half of last year, benchmark home prices in the Lower Mainland of British Columbia have recovered and now stand at new highs (Greater Vancouver: +14% y-o-y; Fraser Valley: +18.5% y-o-y). Benchmark home prices rose by about 14% on a y-o-y basis in Victoria and by 18.5% elsewhere on Vancouver Island in November, on par with y-o-y gains in October.
Price gains have slowed considerably on a y-o-y basis in Greater Toronto, Oakville-Milton and Guelph but remain above year-ago levels (Greater Toronto: +8.4% y-o-y; Oakville-Milton: +3.5% y-o-y; Guelph: +13.4% y-o-y).
Calgary benchmark home prices remained just inside positive territory on a y-o-y basis (+0.3%), while prices in Regina and Saskatoon were down from last November (-3.5% y-o-y and -4.1% y-o-y, respectively).
Benchmark home prices rose 6.7% y-o-y in Ottawa, led by a 7.6% increase in two-storey single-family home prices, by 5.6% in Greater Montreal, driven by an 8.3% increase in prices for townhouse/row units, and by 4.6% in Greater Moncton, led by a 7.8% increase in one-storey single-family home prices. (see table below)
The MLS® Home Price Index provides the best way of gauging price trends because average price trends are prone to be strongly distorted by changes in the mix of sales activity from one month to the next.
This post was written by Dr. Sherry Cooper , Chief Economist, Dominion Lending Centres. It was originally published here.