
Canadian Home Sales Slow for Fourth Consecutive Month
The Slowdown In Canadian Housing Continued in July

Today the Canadian Real Estate Association (CREA) released statistics showing
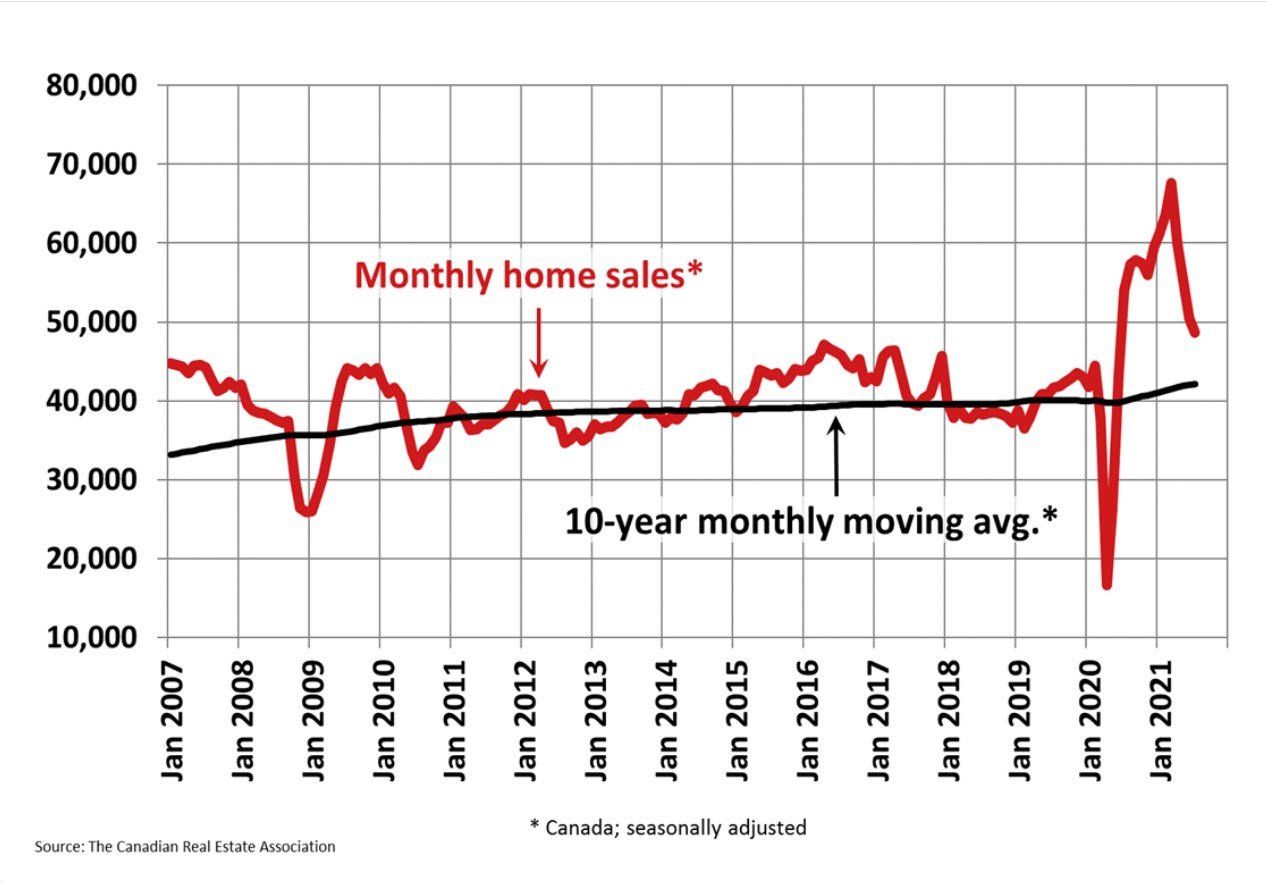
national existing home sales fell 3.5% nationally from June to July 2021--the fourth consecutive monthly decline. Over the same period, the number of newly listed properties dropped 8.8%, and the MLS Home Price Index rose 0.6% and was up 22.2% year-over-year.
While sales are now down a cumulative 28% from the March peak, Canadian housing markets are still historically quite active (see Chart below). In July, the decline in sales activity was not as widespread geographically as in prior months, although sales were down in roughly two-thirds of all local markets. Edmonton and Calgary led the slowdown, but these cities didn't experience falling sales until recently. In Montreal, in contrast, where sales began to moderate at the start of the year, activity edged up in July.
The actual (not seasonally adjusted) number of transactions in July 2021 was down 15.2% on a year-over-year basis from the record for that month set last July. July 2021 sales nonetheless still marked the second-best month of July on record.
“While the moderation of sales activity continues to capture most of the headlines these days, it’s record-low inventories that should be our focus,” said Cliff Stevenson, Chair of CREA. Most markets are in sellers' market territory.
New Listings
The number of newly listed homes dropped by 8.8% in July compared to June, with declines led by Canada's largest cities – the GTA, Montreal, Vancouver and Calgary. Across the country, new supply was down in about three-quarters of all markets in July.
This was enough to noticeably tighten the sales-to-new listings ratio despite sales activity also slowing on the month. The national sales-to-new listings ratio was 74% in July 2021, up from 69.9% in June. The long-term average for the national sales-to-new listings ratio is 54.7%.
Based on a comparison of sales-to-new listings ratio with long-term averages, the tightening of market conditions in July tipped a small majority of local markets back into seller’s market territory, reversing the trend of more balanced markets seen in June.
Another piece of evidence that conditions may be starting to stabilize was the number of months of inventory. There were 2.3 months of inventory on a national basis at the end of July 2021, unchanged from June. This is extremely low – still indicative of a strong seller’s market at the national level and most local markets. The long-term average for this measure is twice where it stands today.

Home Prices
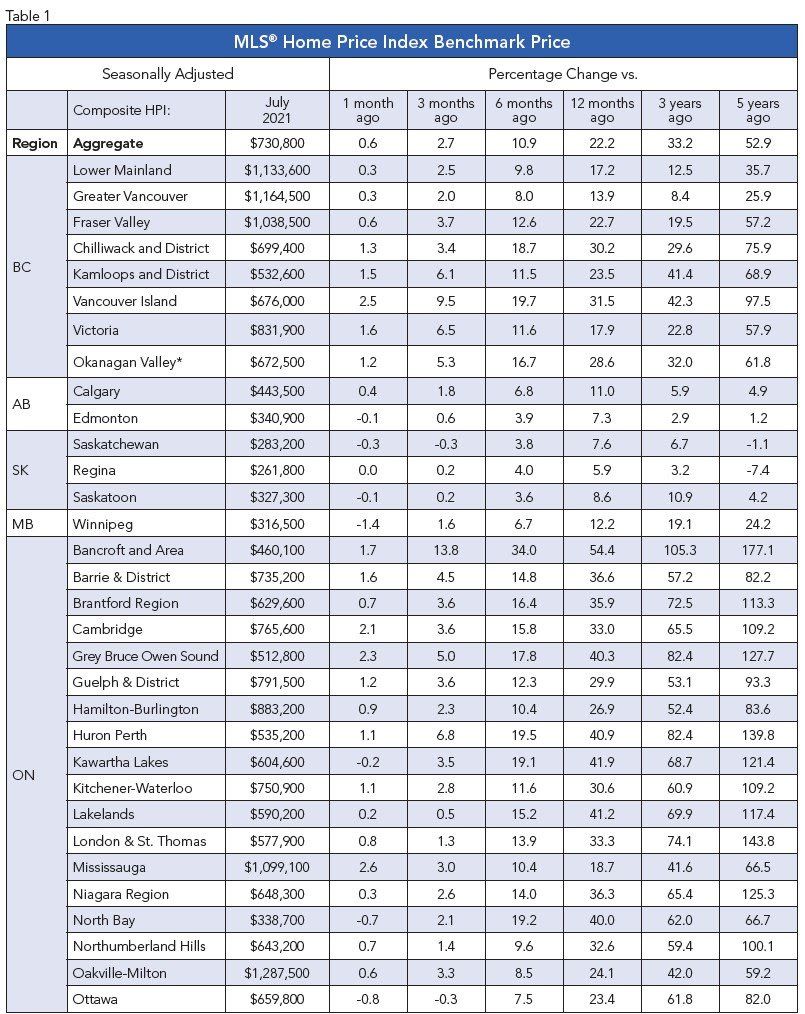
The Aggregate Composite MLS® Home Price Index (MLS® HPI) rose 0.6% month-over-month in July 2021, continuing the trend of decelerating month-over-month growth that began in March. That deceleration has yet to show up in any noticeable way on the East Coast, where property is relatively more affordable.
Additionally, a more recent point worth noting (and watching) just in the last month has seen prices for certain property types in certain Ontario markets look like they might be re-accelerating. This could be in line with a re-tightening of market conditions in some areas.
The non-seasonally adjusted Aggregate Composite MLS® HPI was up 22.2% on a year-over-year basis in July. While still a substantial gain, it was, as expected, down from the record 24.4% year-over-year increase in June. The reason the year-over-year comparison has started to fall is that we are now more than a year removed from when prices really took off last year, so last year’s price levels are now catching up with this year’s, even though prices are currently still rising from month to month.
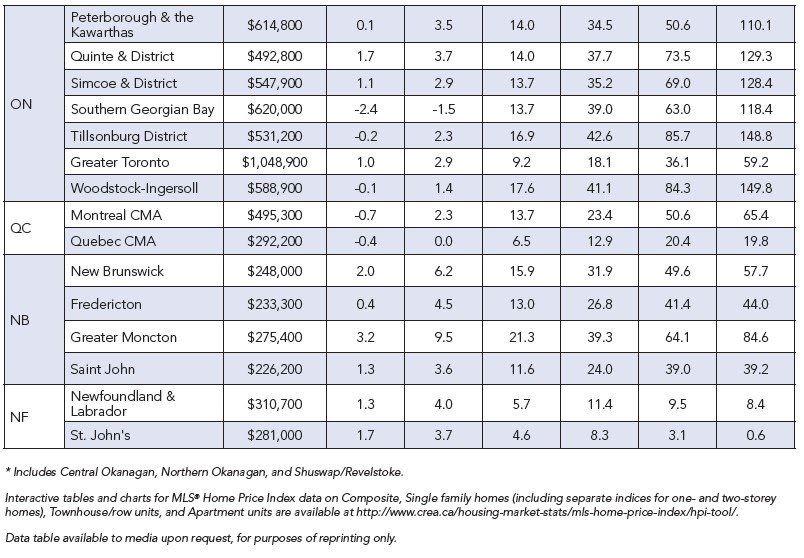
Looking across the country, year-over-year price growth averages around 20% in B.C., though it is lower in Vancouver and higher in other parts of the province. Year-over-year price gains in the 10% range were recorded in Alberta and Saskatchewan, while gains are closer to 15% in Manitoba. Ontario sees an average year-over-year rate of price growth in the 30% range. However, as with B.C., gains are notably lower in the GTA and considerably higher in most other parts of the province. The opposite is true in Quebec, where Montreal is in the 25% range, and Quebec City is in the 15% range. Price growth is running a little above 30% in New Brunswick, while Newfoundland and Labrador is in the 10% range.
Bottom Line
Sales activity will continue to gradually cool over the next year, but it will take higher interest rates to soften the housing market in a meaningful way. Local housing markets are cooling off as prospective buyers contend with a dearth of houses for sale. Though increasing vaccination rates have begun to bring a return to normal life in Canada, that’s left the country to contend with one of the developed world’s most severe housing shortages and little prospect of much new supply becoming available soon.
This article was written by DLC's Chief Economist Dr Sherry Cooper and was syndicated with permission.