
Canadian Home Sales Fall Further in December
December existing home sales decline for the fourth consecutive month.

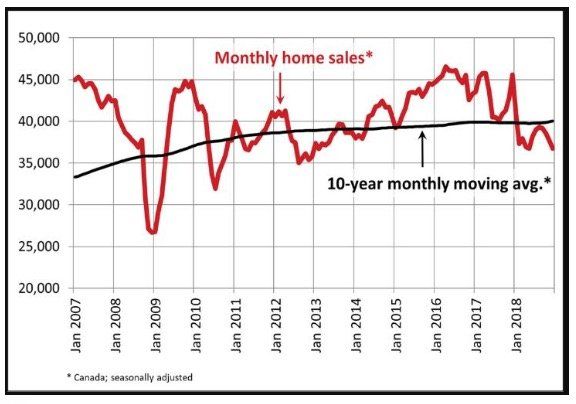
Statistics released today by the Canadian Real Estate Association (CREA) show that national home sales dipped for the fourth consecutive month, down 2.5% from November to December, capping the weakest annual sales since 2012. According to last week's Bank of Canada Monetary Policy Report, housing activity in Canada has fallen by more than the Bank's economists had expected owing to tighter mortgage-qualification restrictions and rising interest rates.
Transactions declined in about 60% of all local markets in December, led by lower activity in Greater Vancouver, Vancouver Island, Ottawa, London & St. Thomas, and Halifax-Dartmouth, together with a regionally diverse mix of other large and medium-sized urban centres.
On a not seasonally adjusted basis, actual activity was down 19% year-over-year in December 2018 and stood almost 12% below the ten-year average for the month. Sales were down from year-ago levels in three-quarters of all local markets, led overwhelmingly by the Lower Mainland of British Columbia, the Okanagan Region, Calgary, Edmonton, the Greater Toronto Area and Hamilton-Burlington. Sales had been boosted in December 2017 by homebuyers rushing to purchase before the new federal mortgage stress test took effect at the beginning of this year.
The Bank of Canada forecasts that the housing market will remain soft this year, undermining economic growth as the mortgage stress test has rendered housing unaffordable for many potential homebuyers.
New Listings
The number of newly listed homes remained little changed (+0.2%) from November to December, with declines in close to half of all local markets offset by gains in the remainder.
With sales down and new listings steady in December, the national sales-to-new listings ratio eased to 53.3% compared to 54.8% in November. This measure of market balance has remained close to its long-term average of 53.5% since the beginning of 2018.
Based on a comparison of the sales-to-new listings ratio with the long-term average, about two-thirds of all local markets were in balanced market territory in December 2018.
There were 5.6 months of inventory on a national basis at the end of December 2018. While this remains close to its long-term average of 5.3 months, the number of months of inventory has swollen far above its long-term average in Prairie provinces as well as in Newfoundland & Labrador. By contrast, the measure remains well below its long-term average in Ontario and Prince Edward Island. In other provinces, sales and inventory are more balanced.
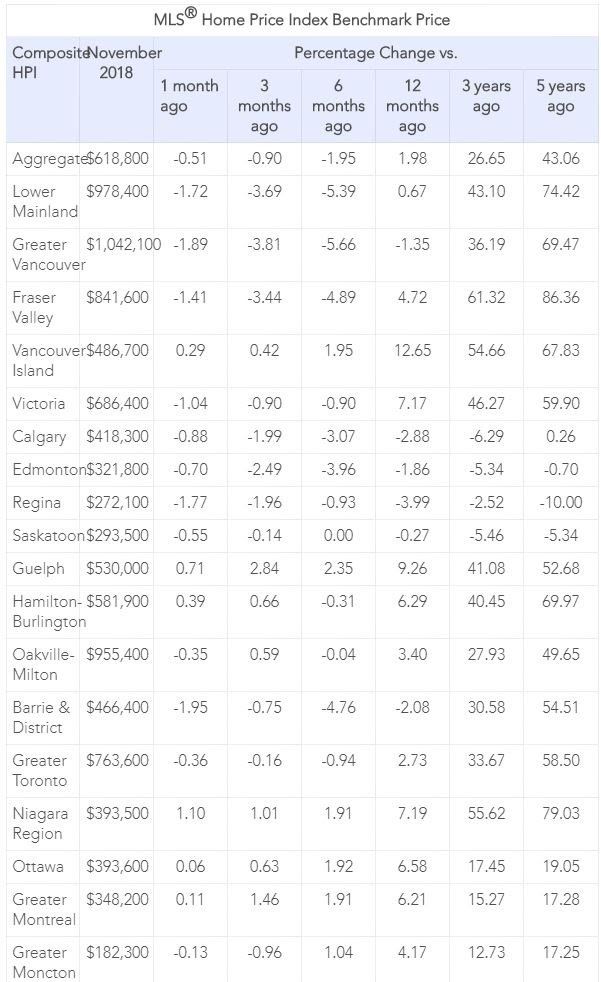
The Aggregate Composite MLS® Home Price Index (MLS® HPI) was up 1.6% y/y in December 2018. The increase is smaller but still broadly in line with y/y gains posted since July.
Following a well-established pattern, condo apartment units posted the largest y/y price gains in December (+4.9%), followed by townhouse/row units (+3.1%). By comparison, two-storey single-family homes posted a small increase (+0.4%) while one-storey single-family home prices eased slightly (-0.3%).
Trends continue to vary widely among the 17 housing markets tracked by the MLS® HPI. Results were mixed in British Columbia. Prices are now down on a y/y basis in Greater Vancouver (-2.7%) but remain above year-ago levels in the Fraser Valley (+2.5%). Meanwhile, prices posted a y/y increase of 6.4% in Victoria and rose 11% elsewhere on Vancouver Island.
Among housing markets tracked by the index in the Greater Golden Horseshoe region, MLS® HPI benchmark home prices were up from year-ago levels in Guelph (+6.8%), the Niagara Region (+6.8%), Hamilton-Burlington (+6.4%), Oakville-Milton (+3.3%) and the GTA (+3%). Home prices in Barrie and District remain slightly below year-ago levels (-1.1%).
Across the Prairies where supply is historically elevated relative to sales, benchmark home prices remained below year-ago levels in Calgary (-3.2%), Edmonton (-2%), Regina (-5.2%) and Saskatoon (-1.2%). The home pricing environment is likely to remain weak in these housing markets until elevated supply reflective of the weak oil market is reduced and becomes more balanced in relation to demand.
Home prices rose 6.9% y/y in Ottawa (led by an 8.3% increase in townhouse/row unit prices), 6% in Greater Montreal (driven by a 9.1% increase in townhouse/row unit prices) and 2.5% in Greater Moncton (led by a 12.2% increase in townhouse/row unit prices). (Table 1, unfortunately, CREA did not update the table with December data as of this writing).
Bottom Line
We are likely in store for a prolonged period of modest housing gains in the Greater Golden Horseshoe, stability or softening in British Columbia and further weakening in the Prairies, Alberta, and Newfoundland & Labrador.
Sluggish sales and modestly rising prices nationally are likely in store for 2019. While there will still be some significant regional divergences, there is no need for further policy actions to affect demand.
This article was written by DLC's Chief Economist Dr. Sherry Cooper, it was originally posted on her blog and newsletter, but we decided to share it here on our blog as well.